Pilinszky's Silence
data visualization
Background
This project was made for a data visualisation brief in my third year on Interaction Design at the Glasgow School of Art. We approached it from a fresh angle and used data from atypical sources, such as poetry and film. However, we used the skills and the workflow that is used to make infographics in the design industry.


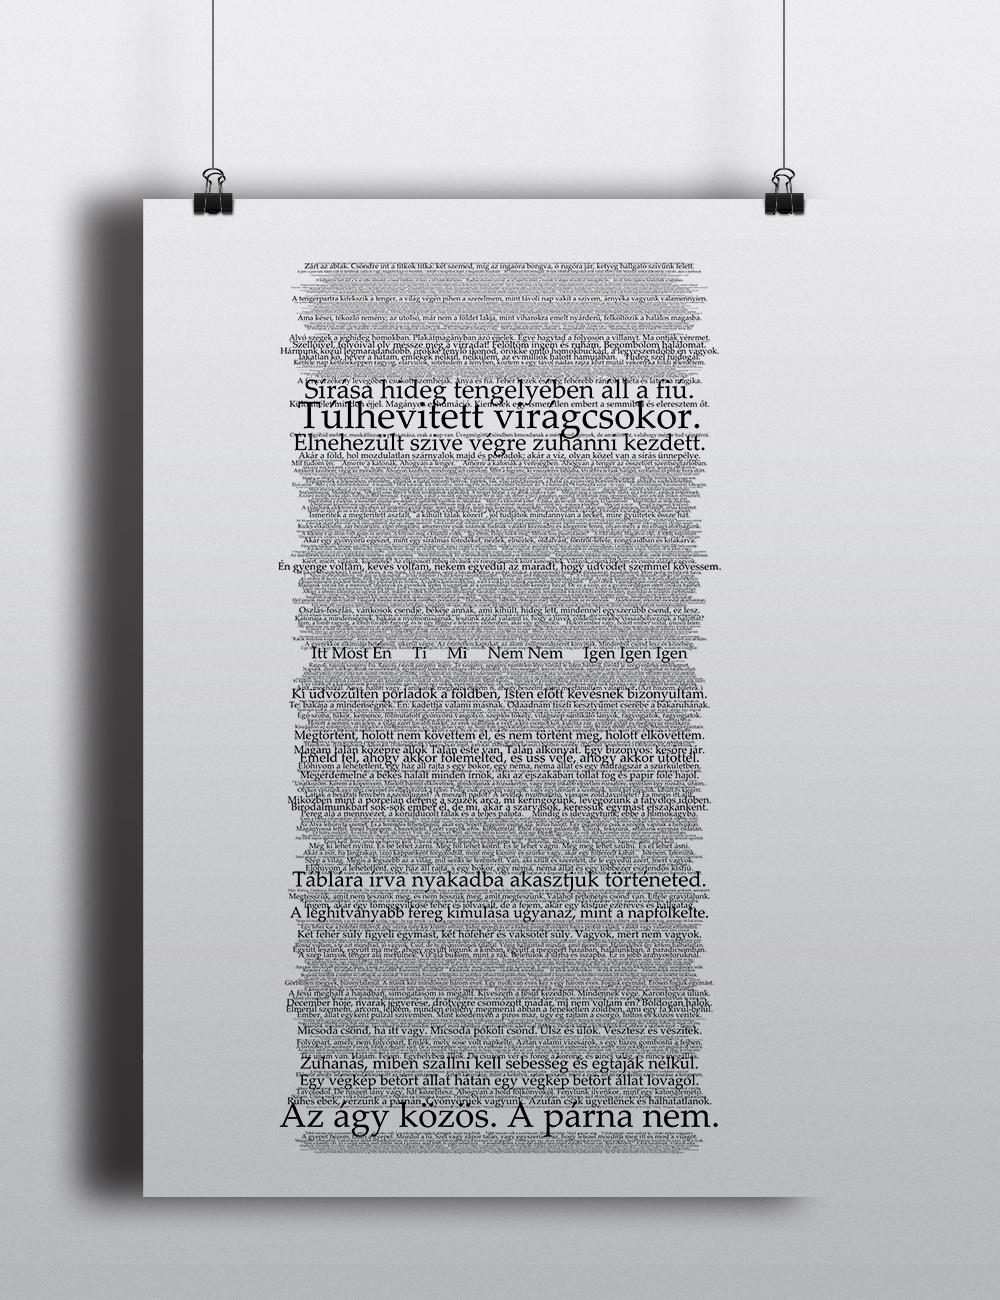
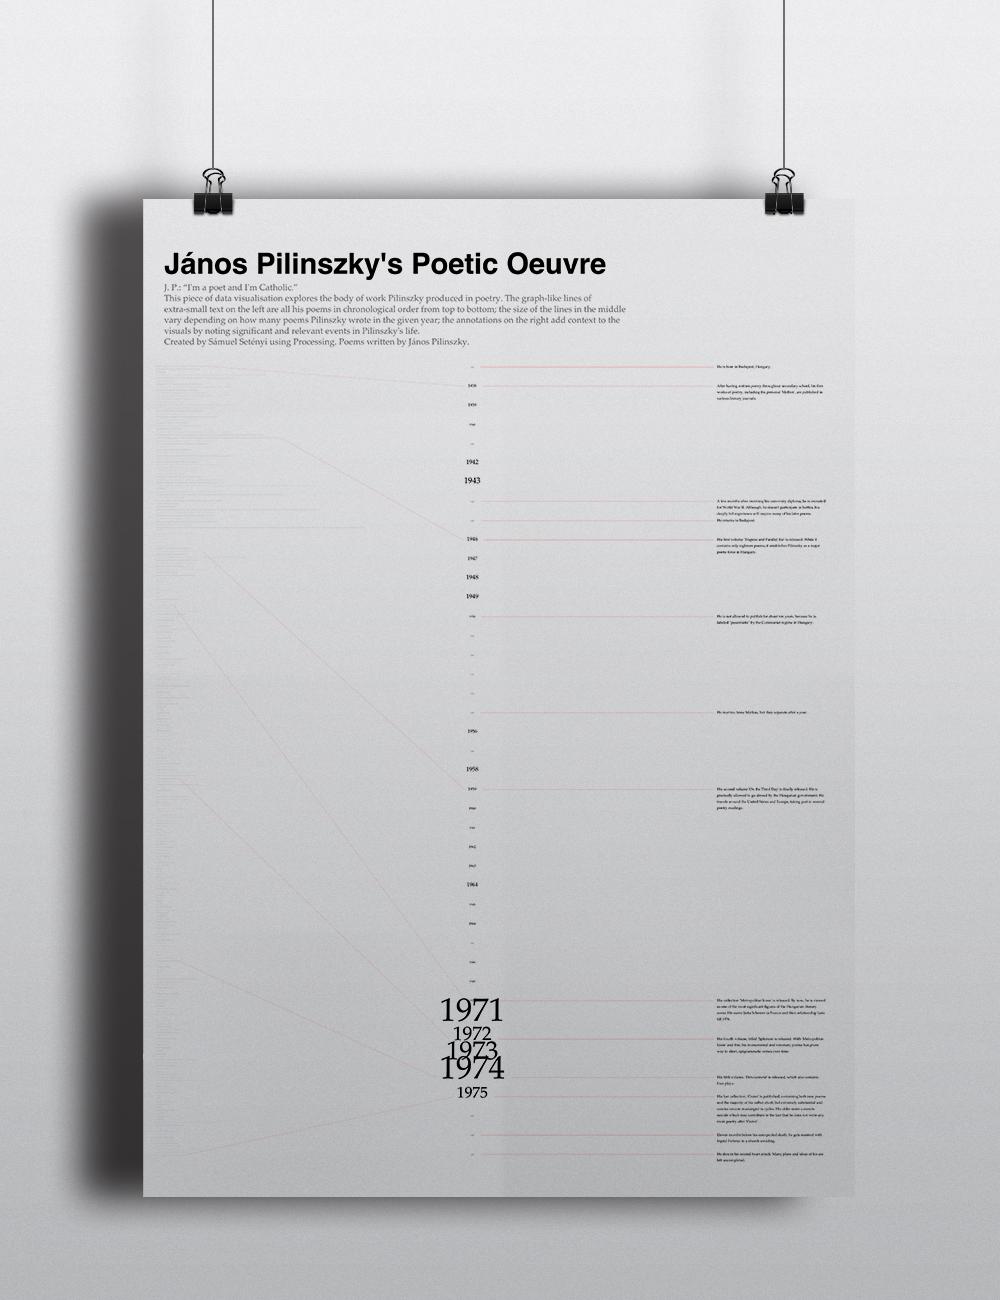
Mockups of the two final visualizations
Text as Texture
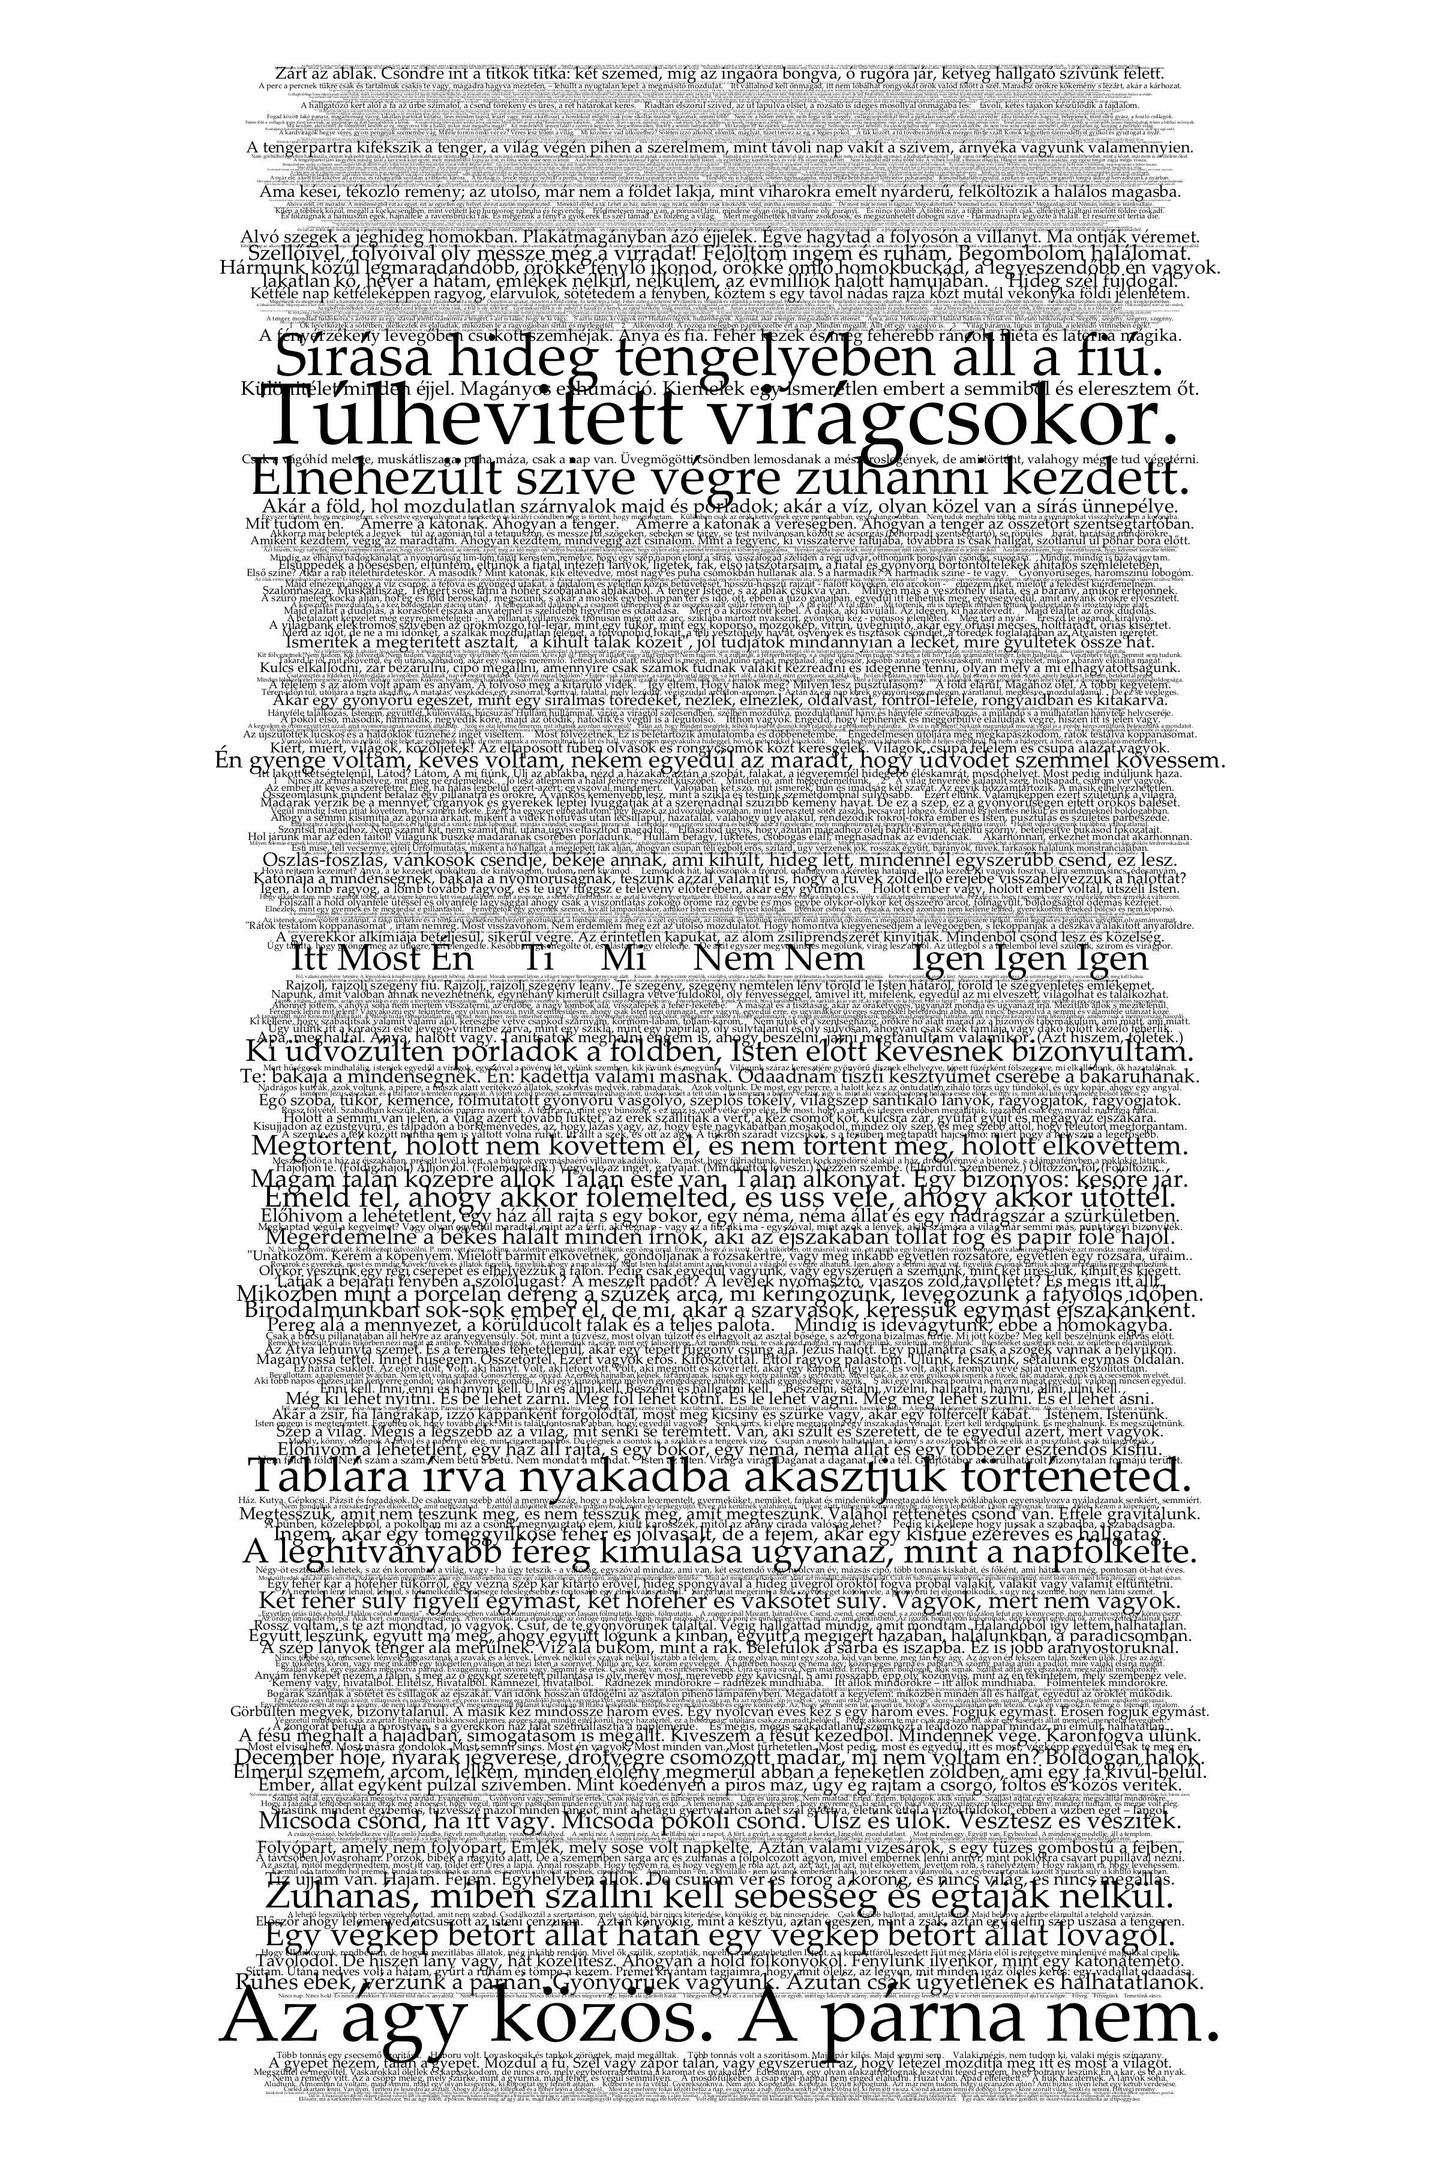
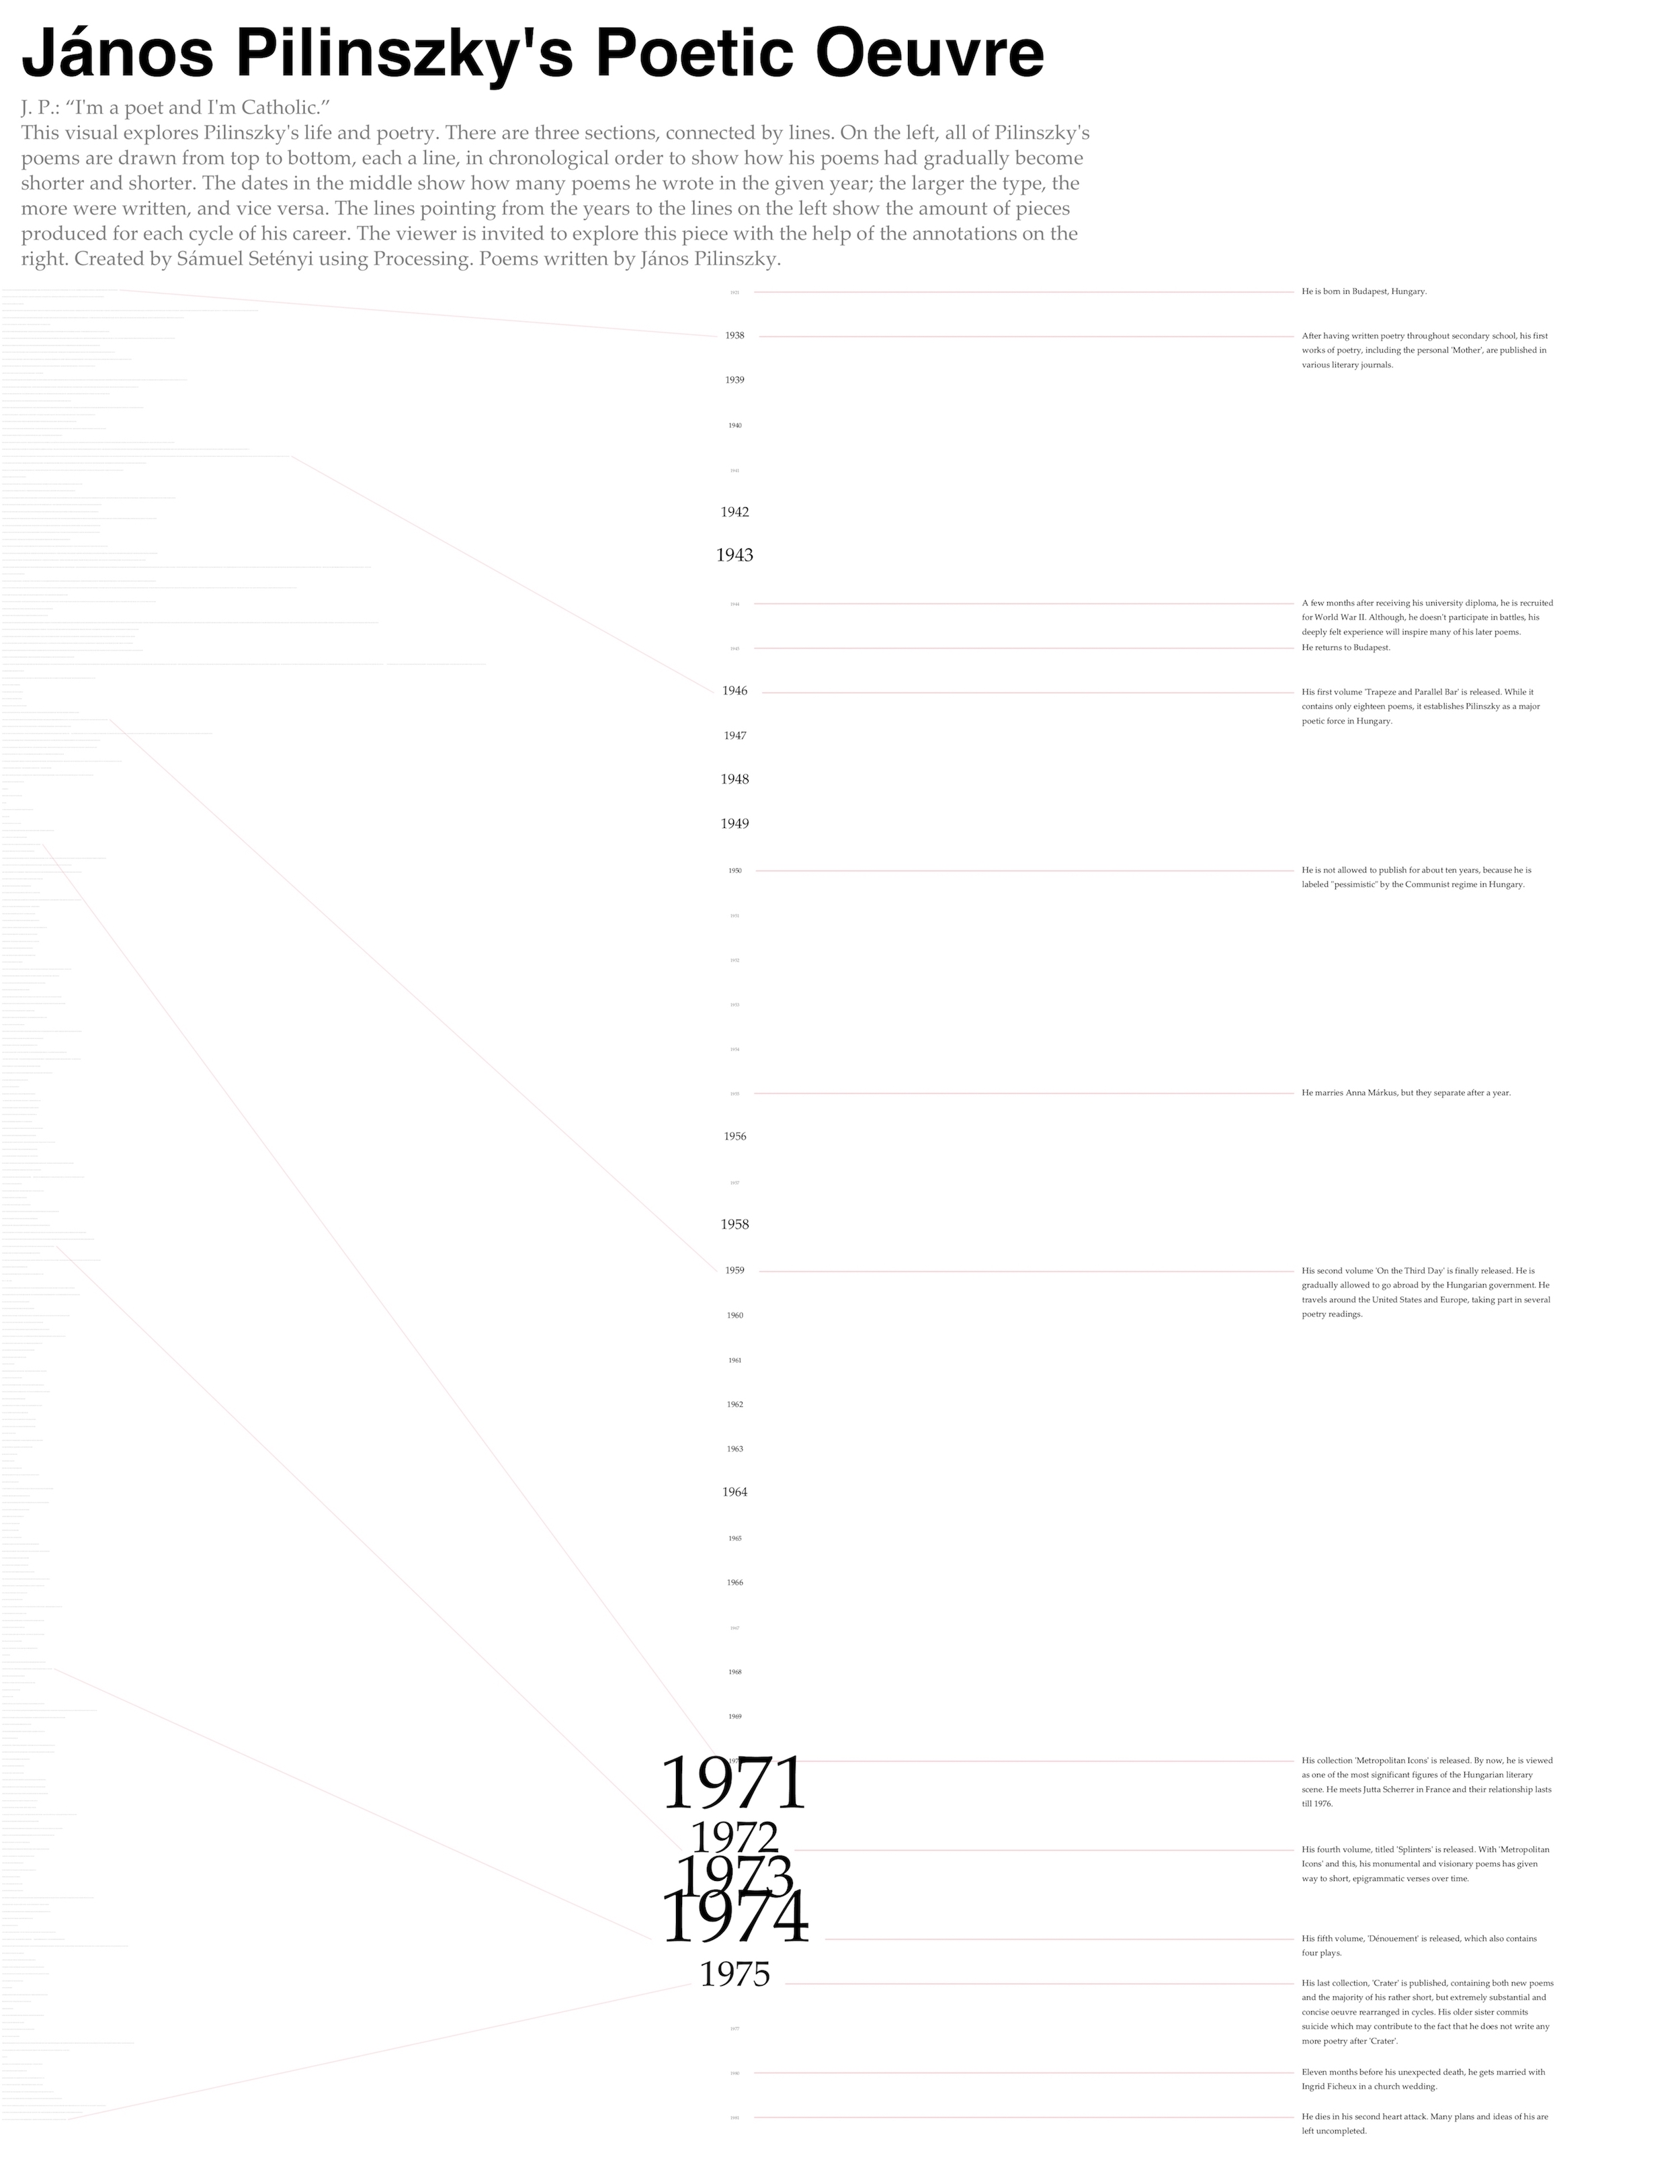
For this piece, I wanted to make an image that explores Hungarian poet János Pilinszky’s body of poetic work in a purely visual way, using text as a kind of texture. I also made another data visualisation which is more like an infographic about Pilinszky’s life.
Infographic
This piece shows each of Pilinszky’s poems in chronological order from top to bottom in sizes varying according to their length. My starting point was the idea of reaching silence as an artist, like composer John Cage did with his silent piece 4'33". With his fourth volume, Splinters, Pilinszky noticeably started writing poems that were more succinct in both form and content and this tendency continued until he reached complete silence in 1975 when he stopped writing poetry.
Behind the Scenes
These visuals were generated entirely by code, using Processing. For the second piece, I created a CSV spreadsheet and used it to drive the visuals. I saved the poems and other necessary data from the Hungarian Digital Literary Academy and processed them with the algorithm I wrote in Processing.

Pilinszky's Silence (Textural Visualization)

Pilinszky's Silence (Infographic)